2016 Operating Cost Study: An Overview
Use Operating Cost Study data and ratios to make informed business decisions This article is an excerpt from the 2016 Operating Cost Study“for the Landscape Industry,” conducted and prepared by Dan Gordon, a certified public accountant and managing member of Turfbooks. It’s brought to you by LM and the National Association of Landscape Professionals (NALP). Information for the preliminary results included in this article were collected in May, June and July from members of the landscape industry. It was submitted in Excel or a hard copy format. The incentive to participate is a free digital copy of the final report, due out later this year.
How would you like to understand your company’s strengths and weaknesses compared to others in the landscape industry? And how about gaining insight into efficiency and your financial position to potentially attract financing or outside capital? With goals like these in mind, we created this report to help you make more informed decisions to grow and prosper.
Measuring performance using key performance indicators (KPIs) and ratios from the immediate past history provides great insight into the current health of individual companies and the collective industry. Let’s get into the numbers.
2016 Operating Cost Study: Ratio analysis
Financial ratios are used widely to evaluate business performance and to identify possible trouble areas that could result in reduced profits or even business failure.
Industry indicators of financial performance are useful to those lending money or to those thinking about investment because they allow comparison of the firm under consideration with the industry in general. Managers and owners also use industry data to evaluate their own situations and to develop internal plans in which they might compare current and past performance.
The 2016 Operating Cost Study looks at many different senerios. For example, is cash flow getting tight? Are accounts receivable taking longer to collect? Is additional debt being incurred? People have a tendency to improve what is being measured. Call it competition; call it business acumen or whatever you’d like, but most people want to be part of a winning team. So, looking at proper metrics with an eye on improvement is helpful to winning the game of business.
Ratio analysis helps to quickly analyze the business.
In the 2016 Operating Cost Study, we used ratio analysis in the following areas: profitability; financial position; liquidity; activity; leverage; and other important ratios. Liquidity, leverage and other important ratios are not included in this excerpt but are available in the full report.
2016 Operating Cost Study: Participant profile
The study contains data from 60 firms reporting in 32 states. The median employee count, revenue per employee, revenue per customer and mix of services were tabulated from the data reported:

(Image courtesy of landscapemanagement.net)
*FTE = Full Time Equivalents. An FTE equates to the hours worked by one employee on a full-time basis. The concept is used to convert the hours worked by several part-time employees into the hours worked by full-time employees. On an annual basis, a FTE is considered to be 2,080 hours, which is calculated as: 8 hours per day x 5 work days per week x 52 weeks.

(Image courtesy of landscapemanagement.net)
2016 Operating Cost Study: Profitability
The income statement is one of the major financial statements used by accountants, financial institutions and business owners to determine entity profitability.The income statement is sometimes referred to as the profit and loss statement (P&L), statement of operations or statement of income. It’s important because it shows the profitability of a company during the time interval specified in its heading.
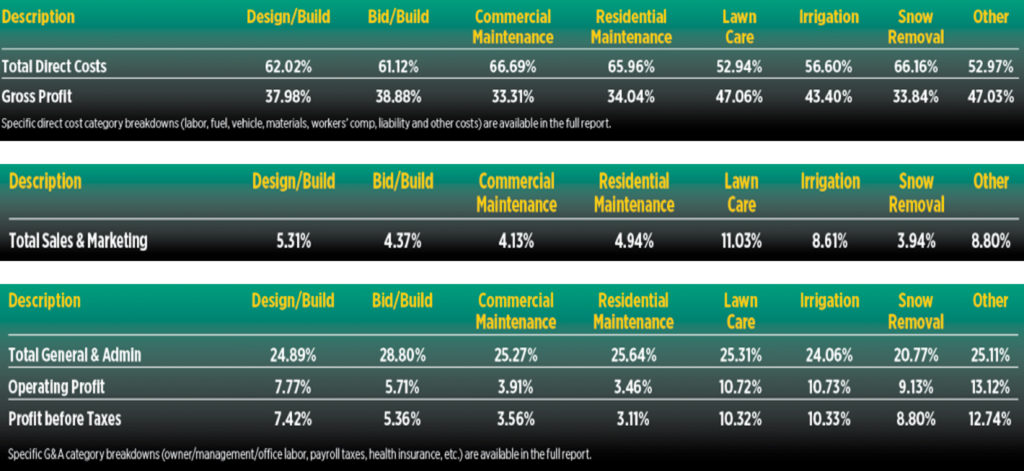
In the tables above, the medians of each market segment were taken and converted into percentages for presentation. Of the 60 companies that reported, there were none that reported working only in one segment. Each participant provided two or more services with 82 percent of the respondents reporting at least four of the services.
While the financial performance varied from company to company, the tables above depict the median company results for each category. These results are in line with the percentages we see for the various service lines among the clients in our accounting practice.
Financial position or balance sheet
The balance sheet report summarizes all of an entity’s assets, liabilities and equity as of a given point in time. It’s typically used by lenders, investors and creditors to estimate the liquidity of a business. Typical line items included in the balance sheet by general category are:
- Assets: cash, accounts receivable, inventory; property, plant and equipment; and other assets.
- Liabilities: accounts payable, short-term debt and long-term debt;
- Shareholders’ equity: stock and retained earnings.
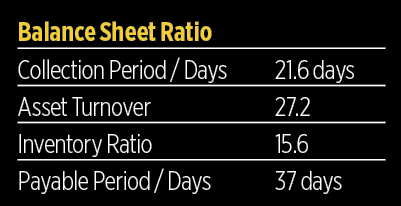
At right is the raw data with regard to financial position that was collected for the study, expressed as percentages.

Operating Cost: An important distinction- A balance sheet is not a statement of net worth, as assets are recorded at historic costs and may have appreciated or depreciated since being recorded. In addition, intangibles such as the value of customer relationships—which can be significant—for the most part will not be on the balance sheet.
For this study, every respondent provided services in multiple service lines, but balance sheets were reported on an entire entity basis. This means the ratios calculated from balance sheet results should be interpreted on a companywide basis as opposed to a particular service segment.
Operating Cost: Activity Ratios
Our 2016 Operating Cost Study activity ratios indicate how efficiently a firm uses and manages its resources, including cash, accounts receivable, salaries, inventory and property, plant and equipment. Higher ratios may signify efficient use of those resources, while lower ratios may signify inefficient use of those resources.
Activity ratios provide an indication of how efficiently a firm runs its operations. For example, all other factors being equal, a firm that keeps a very modest amount of inventory is usually in better shape than a firm that has to keep (store, manage, warehouse, insure and so forth) a large quantity of inventory.
Some activity ratios are operational as opposed to financial. One such activity ratio would be revenue per employee.
Here’s a look at key activity ratios:
Revenue per employee (FTE): The more revenue we produce per employee, the more efficient we’re using the resources (in this case people resources) we have.
Revenue per customer: Obviously, you need to have a consistent definition of what a customer is (not just a name in your database but rather someone you continue to do business with). I love this ratio because you can review the number with your sales team and create very specific future goals.
For example, say your average lawn care customer yields $500 per year. Let’s increase that figure by 10 percent to $550 per customer. It’s very easily measured.
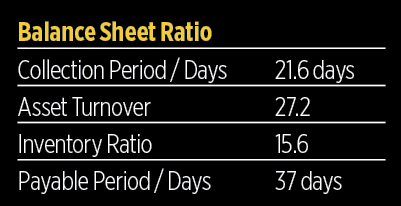
Collection period / days: This ratio tells us how efficient we are at collecting our money or holding our customers to our credit terms.
For example, a company producing $365,000 in sales (which translates to $1,000 per day) that grants its customers 30-day terms should have $30,000 in A/R.
Be careful when using this ratio: Make sure all prepaids/customer deposits are backed out of your accounts receivable number so that it’s a true A/R number.
Asset turnover:
Generally, the higher the asset turnover ratio, the better the company is performing, since higher ratios imply the company is generating more revenue per dollar of asset. This ratio can vary widely from one industry to the next. While this is a widely used KPI in the finance world, it works best in industries where there is a heavy investment in assets.

With the exception of landscape construction, most firms in our industry use labor to a much higher degree than fixed assets; therefore, I don’t put as much emphasis on this ratio as I do some of the others. Again, this is just another tool in the financial tool chest.
Inventory ratio: Inventory turnover is a ratio showing how many times a company’s inventory is sold and replaced over a period. The days in the period can then be divided by the inventory turnover formula to calculate the days it takes to sell the inventory on hand or “inventory turnover days.” A low inventory ratio is usually a bad sign. Inventory may be over ordered or sales may not be as robust.
Here’s a big caveat: Many times at year-end—for both tax reasons and the fact that many distributors give great year-end incentives—many firms purchase large amounts of inventory, which will drive up the inventory account in a big way. Carefully consider this abnormality when making comparisons.
Profit per employee: Again, this is not straight off the financials (as the financials don’t note FTEs). However, this is an especially useful ratio. Often in the heat of battle we start adding employees without a proper plan or the real-time information to determine if it’s a good idea. This ratio helps to determine if you’re making an acceptable profit for each employee. If you benchmark profit per employee, you can make decisions about human resources and determine if you can afford an increased head count.
Payable period days: Similar to days of sales in A/R, this data point measures a firm’s payment history as a number of days, letting you know if you’re meeting your obligations in a timely manner. If your vendors give 30-day terms and you’re paying in 25, you’re able to meet your obligations within terms.
If you pay in 35 days, then you’re not meeting your obligations in a timely manner. If you have the ability to consistently pay your vendors quickly, many vendors may offer a discount. Terms such as “2/10 net 30” can save you a significant amount of cash. These terms would be to take a 2 percent discount if you pay within 10 days or else pay in full by 30 days.
Profitability Ratios
Profitability ratios reflect the overall effect of a firm’s managerial efficiency. These ratios are indicators of a firm’s break even point and the amount of money that’s made once breakeven is achieved given a certain level of sales. They reflect the results of decisions that management has made in order to maximize profitability.
They are also a class of financial metrics that are used to assess a company’s ability to generate earnings compared to its expenses and other relevant costs incurred during a specific period of time.

(Image Curiosity of Landscapemanagement.net)
Gross profit %: This ratio shows us how efficient a firm is at providing services before paying sales, marketing and fixed costs. In my opinion gross profit is the single most important financial ratio.
Operating expense %: If operating expenses exceed gross margin you will operate at a loss. If they are truly fixed, the fixed cost percentage will fall as a firm grows.

(Image courtesy of landscapemanagement.net)
Profit margin: This is what you work for—net income.
EBITDA: Earnings before interest, taxes, depreciation and amortization. This is cash flow!
Return on assets: This is one that for comparison purposes may work for companies that employ a high value of assets. From my prospective this ratio is better suited to looking at your portfolio of investments as opposed to fixed assets.
My reasoning is that our biggest asset in the service business is our people. With the exception of construction, most firms don’t employ high values of assets, but rather they use a high value of direct labor.
Return on equity: This ratio answers the question, “What is the return on that piece of the balance sheet called equity?” Again, it’s great to do comparisons with other firms, but equity is such a loose concept in small, privately held businesses.
This Article was originally posted in the 2016 Operating Cost Study: How you Stack Up
